Creating a Line Chart Component
Create a component using schematics and name it with your initial E.g:
jd-chart
We are going to make it render rechart's Line Chart https://recharts.org/en-US/examples/SimpleLineChart.
To do this:
-
Install the recharts module with:
yarn add recharts -
Import the components needed in src/components/JdChart.tsx with:
import { LineChart, Line, XAxis, YAxis, CartesianGrid, Tooltip, Legend } from 'recharts'; -
Add the example data:
json
const data = [
  {
    name: 'Page A',
    uv: 4000,
    pv: 2400,
    amt: 2400,
  },
  {
    name: 'Page B',
    uv: 3000,
    pv: 1398,
    amt: 2210,
  },
  {
    name: 'Page C',
    uv: 2000,
    pv: 9800,
    amt: 2290,
  },
  {
    name: 'Page D',
    uv: 2780,
    pv: 3908,
    amt: 2000,
  },
  {
    name: 'Page E',
    uv: 1890,
    pv: 4800,
    amt: 2181,
  },
  {
    name: 'Page F',
    uv: 2390,
    pv: 3800,
    amt: 2500,
  },
  {
    name: 'Page G',
    uv: 3490,
    pv: 4300,
    amt: 2100,
  },
];
4. Replace the JSX:html <div> <p>jd-chart works. Please edit src/components/JdChart.tsx to make changes</p> <h3>Next Steps</h3> <ul> . . . . </ul> </div>To:
html
    <LineChart
          width={500}
          height={300}
          data={data}
          margin={{
            top: 5,
            right: 30,
            left: 20,
            bottom: 5,
          }}
        >
          <CartesianGrid strokeDasharray="3 3" />
          <XAxis dataKey="name" />
          <YAxis />
          <Tooltip />
          <Legend />
          <Line type="monotone" dataKey="pv" stroke="#8884d8" activeDot={{ r: 8 }} />
          <Line type="monotone" dataKey="uv" stroke="#82ca9d" />
    </LineChart>
You should see the component build in the npm watch window:

webpack 5.14.0 compiled <span style="color:green">successfully</span> in 208 ms
-
Reload the component test template. A Line Chart will display:
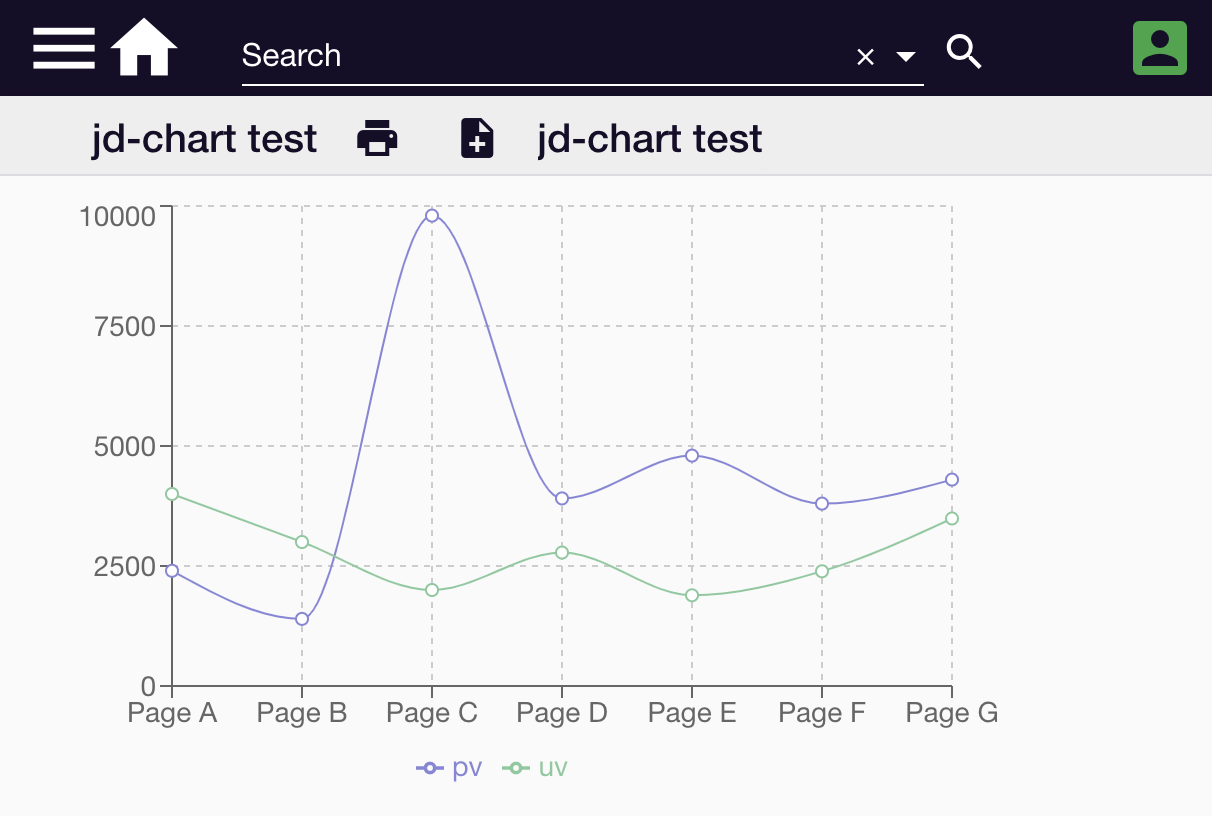
This example is available at https://github.com/formbird-components/component-examples/tree/master/jd-chart